Structural Visualization & Data Analysis & Action Visualization
Structural Visualization is an auxiliary analysis tool that comes with IDE software. It consists of three main functions: structure Visualization, data analysis, and action Visualization, which help users analyze the structure of the project and the resource usage of the project.
In the personal space interface, right-click on the project icon and select Structure Visualization or Data Analysis to enter the corresponding analysis interface.
Structure Visualization

The structure Visualization interface is as follows, showing a tree view of the distribution of windows, sub-windows, and controls for all interfaces in the selected project, demonstrating the structural relationships of the projects at different levels.
The white node indicates that the content of the lower level is expanded, and clicking on it will collapse all the content of its lower level; the gray node indicates that the content of the lower level is collapsed, and clicking on it will display the content of its next level.
When hovering over the object name, you can see its bound variables, width, height, number of subordinate sub-items and other information.

Data Analysis

The data analysis interface is as follows, displaying the number of all pages, windows, views, controls in the project, occupied storage resources, variable bindings, and timer counts. It mainly counts the relationship between the number of controls and resources on different pages.
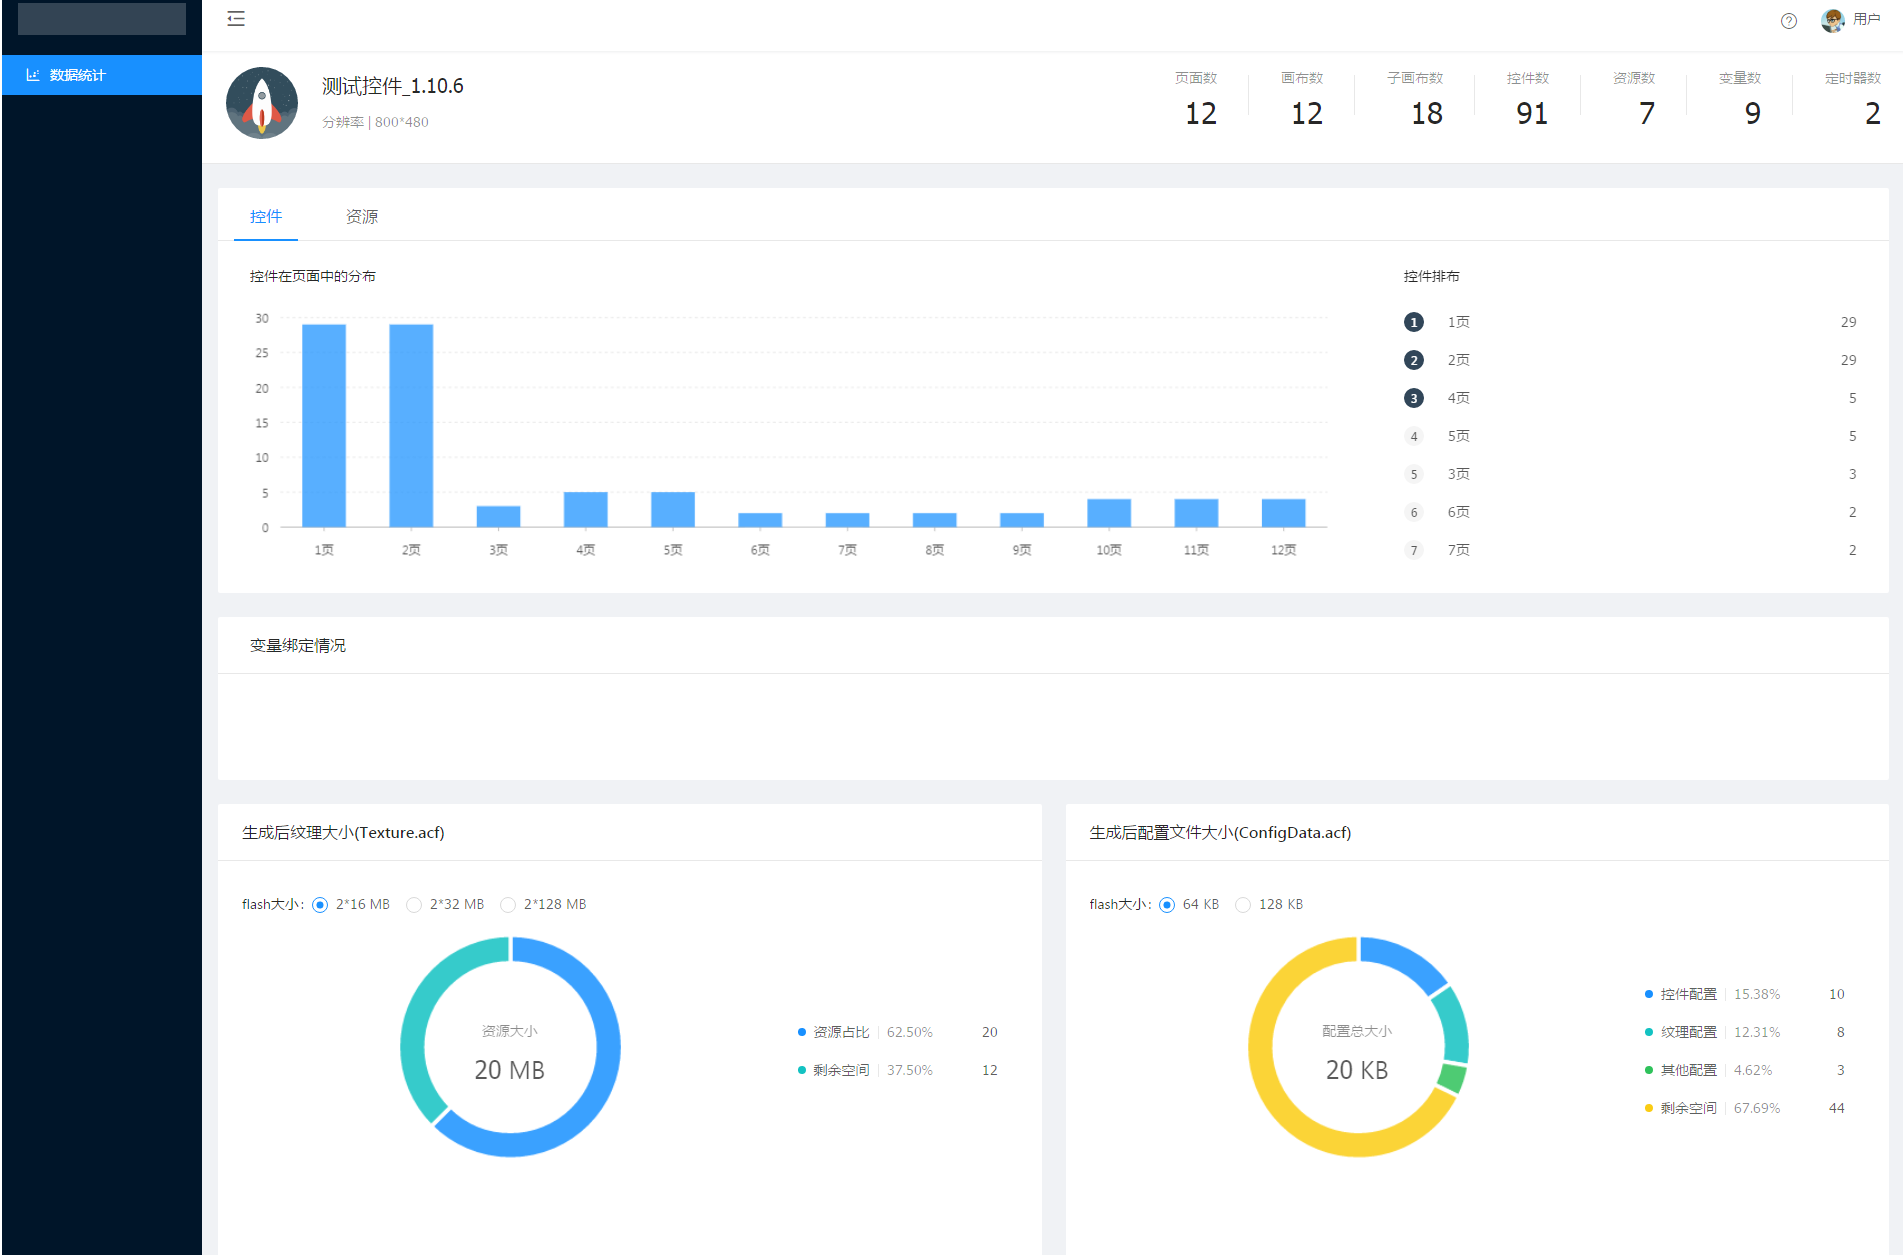
Post-generation texture size and configuration file size is the file size when the project is generated into a zip package with one click and burned to the display system. It helps users to control the resource overhead and avoid the file content is too big to be burned to the system. The generated texture size (texture.acf) mainly depends on the number and size of resources uploaded by the user, and the configuration file size (configdata.acf) is greatly affected by the complexity of the interface, the more interface interactions, controls and actions, the larger the configuration file.
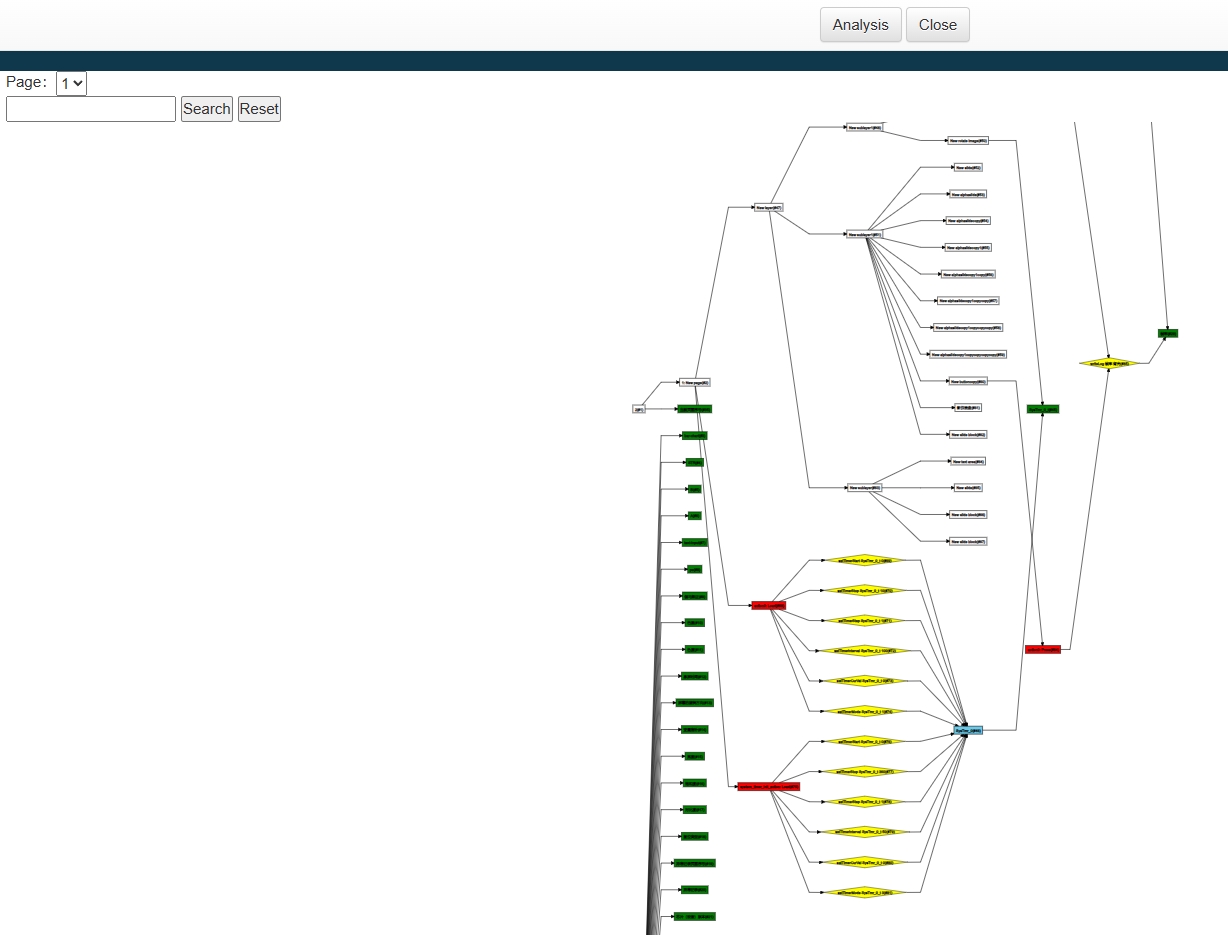
Action Visualization
Open a project, click "Edit-> Action Visualization" and then click "Analyze" to enter the action Visualization interface.

In the action Visualization interface, you can see the hierarchical relationship of pages, windows, views, controls, unused variables, and all the action commands in the pages and controls, which makes it easy to analyze the commands of the whole project in a coordinated way.