Run Debug
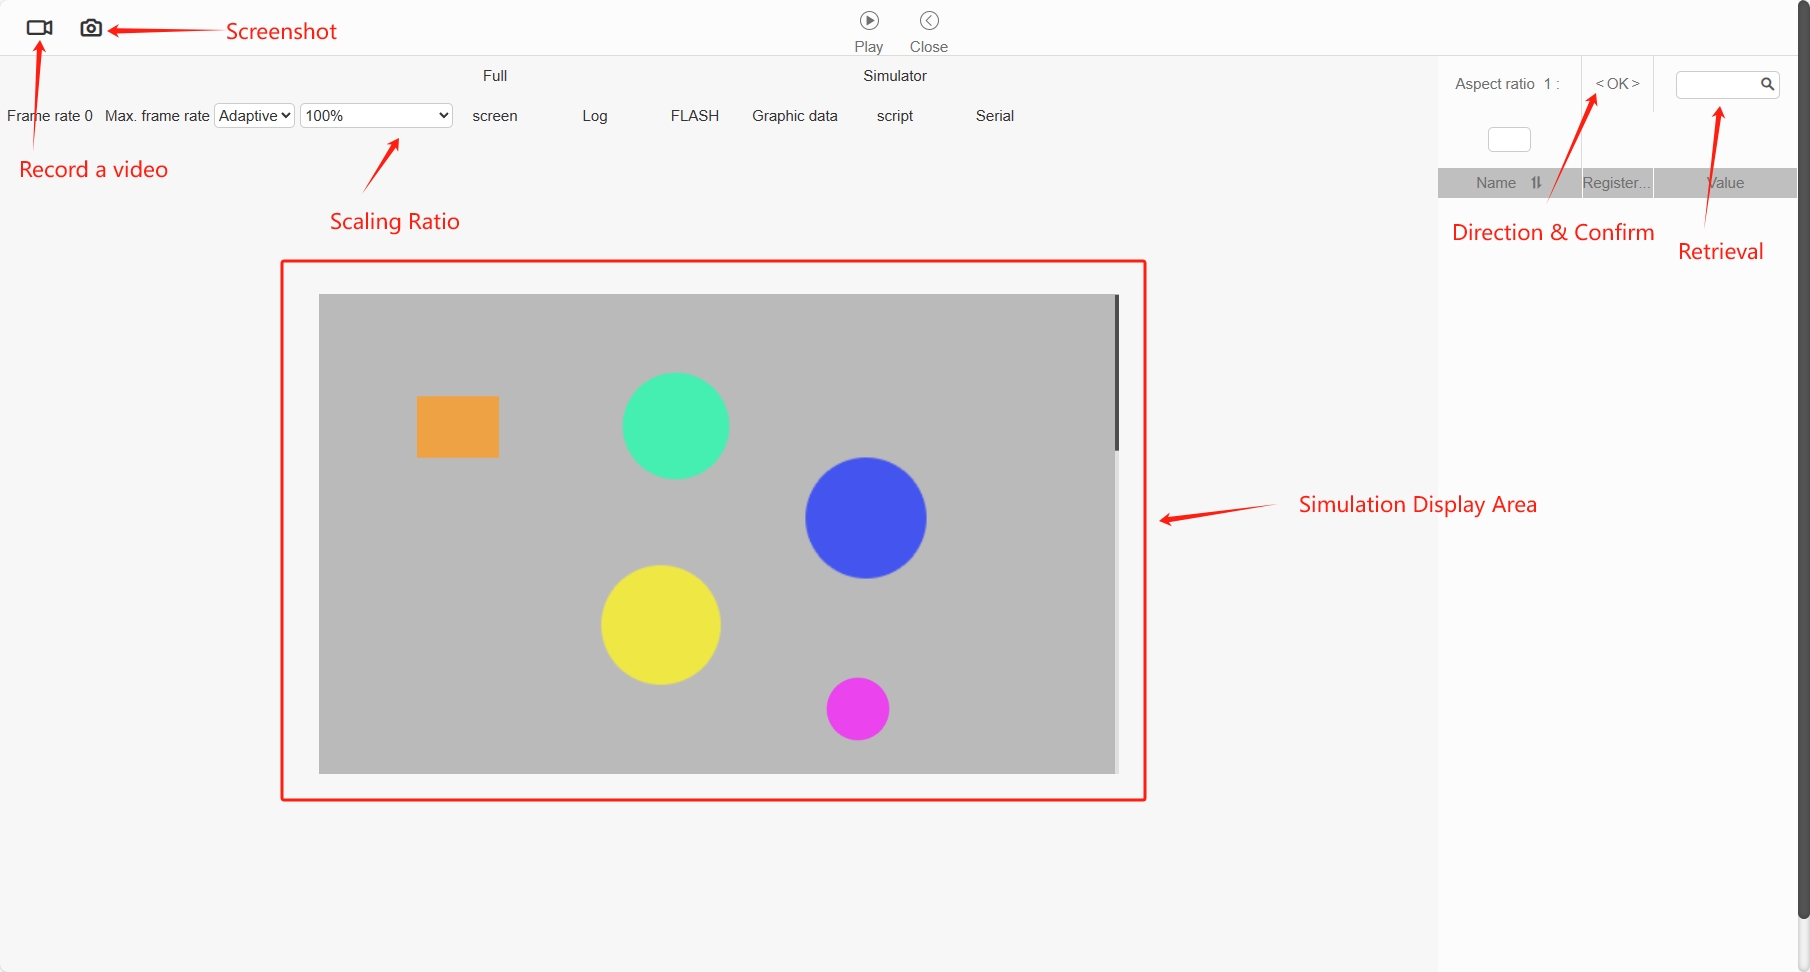
Click the "Open Simulator" icon in the "Edit" menu to enter the debug interface. You can realize online real-time simulation of the project.

Click "Run" at the top of the interface to start run debug. Click "Close" to end the debug.

Support to record the debug interface, click the Record Video button on the upper left corner to record the video of the emulation area.

Note: Currently the screen recording function only supports chrome browser.
Frame Rate displays the frame rate of the drawing in the current simulation area.
Zoom ratio adjusts the size of the simulation area in the debug interface.
The user can also change the aspect ratio of the simulation area to deform the interface in aspect, which is mainly used to simulate screens with non-square pixels.

Physical keys are used to simulate highlighting and key clicks.

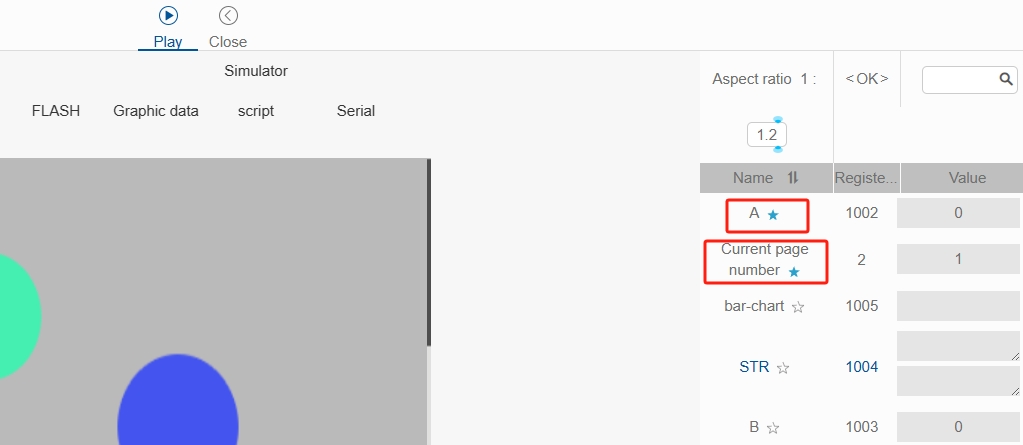
In the latest version of IDE, the most frequently used system registers have been topped by default, as shown in the figure below, and the user can also click on the pentagram to confirm or cancel the topping of the register.

In the latest version of IDE, the full-screen display function has been added, you can maximize the preview of the interface effect after clicking the "Full Screen" button.
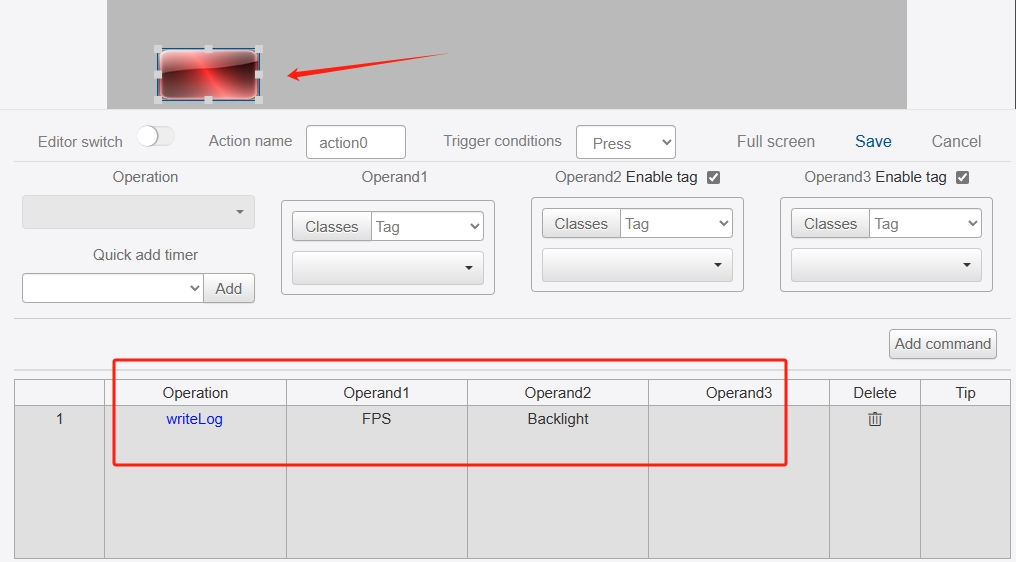
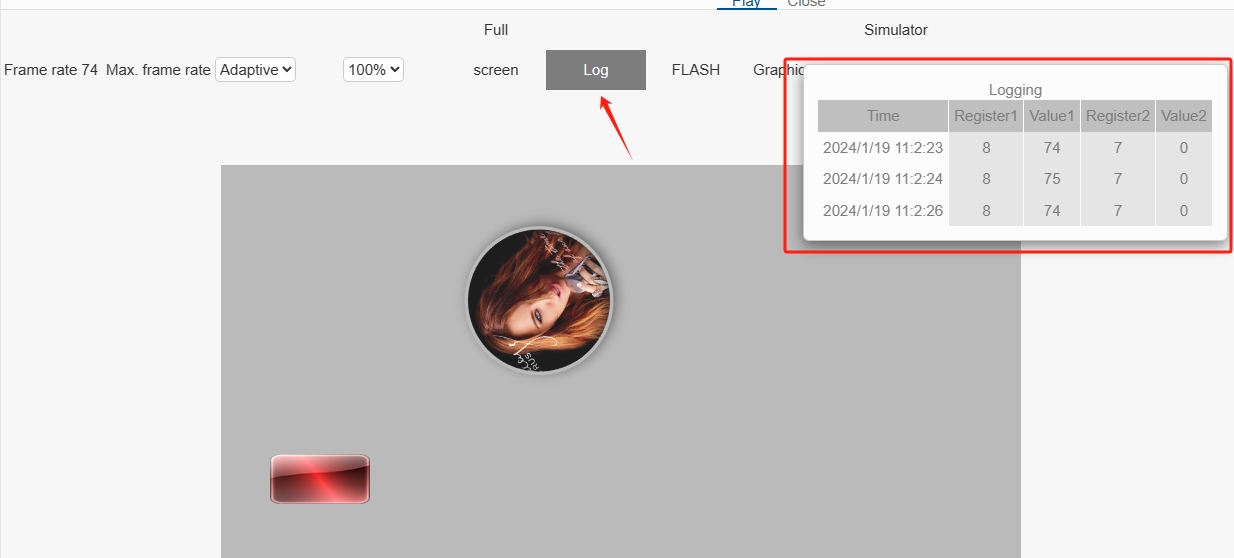
If you enable the "writelog" command in the interface, you can open the "log" to print the current information of the variable during the simulation in the IDE. For example, add a button in the project, the command executed when the button is pressed: "writelog Frame rate Backlight".

Then in IDE simulation if logging is turned on, every time the button is clicked it will print out the time and the value of these two registers at the current time.

Variable list and register list show the serial numbers of variables and registers enabled in the project, and the user can change the variable values and register values.