Pie Chart
The Pie Chart control uses multiple sectors to display the weights between items. The Pie Chart control supports input arrays and dynamically displays changes in the weights between items.
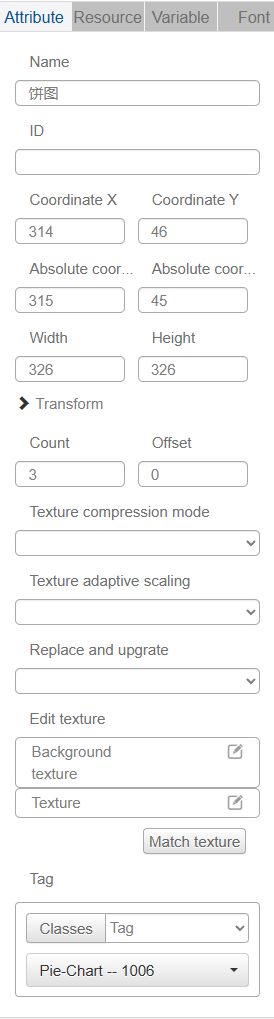
Name, ID, Coordinates, Width, Height, Block Touch, Transform, Texture Compression Mode, Replaceable Upgrades, Texture are common properties, which are described in the "Basic Design - Edit Properties" section, and Maximum, Minimum, Low Alert, High Alert, Start Angle, Initial Value properties are similar to those described in the Dashboard control. Maximum, Minimum, Low Alert, High Alert, Start Angle, Initial Value properties are similar to the properties described in the Dashboard control and will not be repeated here.
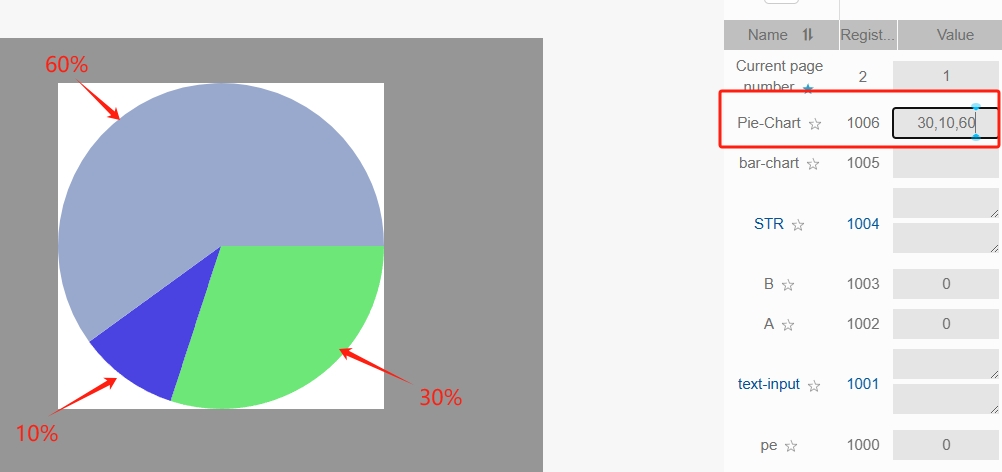
Quantity is used to set the number of items to be compared, e.g. if there are three items to be displayed in a pie chart, set the quantity to 3.
Offset can be used to adjust the position of each item in the pie chart.
Texture Settings - Background sets the background image style of the pie chart.
Texture Settings - Texture sets the style of the items in the pie chart.
The type of variables bound to the pie chart control should be set to array, and the types of array elements are u8(unsigned char),u16(unsigned short),u32(unsigned short),s8(signed char),s16(signed short),s32(signed long). The parameter setting depends on the type of data to be transmitted.
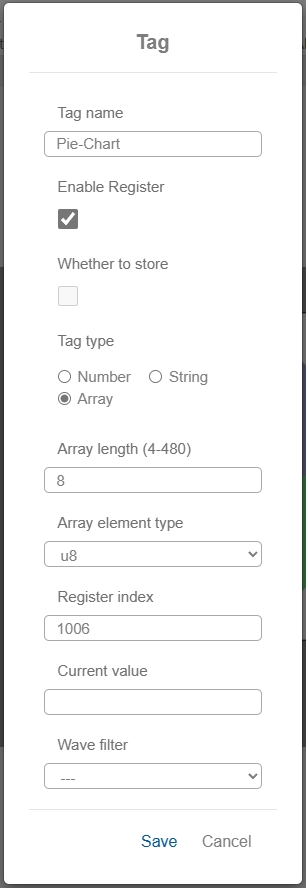
We set the number of pie chart to 3, the array type to u8, the length of the array to 8, and press Enter after inputting the array [30,10,60] in the IDE simulation, at this time, the pie chart control displays the image as follows: