Bar Chart
The Bar Chart control uses multiple rectangular bars to show changes in data over time or to show comparisons between items. The Bar Chart control supports the input of arrays to dynamically display items.
Name, ID, Coordinates, Width, Height, Block Touch, Transform, Texture Compression Mode, Replaceable Upgrades, Texture are common properties, which are described in the "Basic Design - Edit Properties" section, and the Maximum, Minimum, Low, High, Start Angle, Initial Value properties are the same as the Gauge control. Maximum, Minimum, Low Alert, High Alert, Start Angle, Initial Value properties are similar to the properties described in the Dashboard control and will not be repeated here.
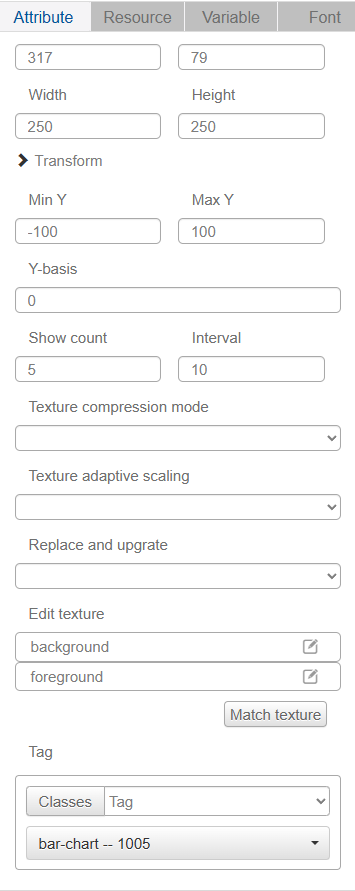
The Y Min and Y Max values correspond to the minimum and maximum values of the display range of the bar graph.
The Y reference is used to adjust the display position of the reference (usually 0).
The number of displays is used to set the number of data sets to be displayed simultaneously for comparison.
Spacing is used to set the horizontal spacing of each rectangular bar.
Texture Settings - Background sets the background image style of the bar graph.
Texture Settings-Foreground sets the style of the rectangle bars in the bar graph.
The variable type bound to the bar graph control should be set to array, there are 6 types of array elements: u8(unsigned char), u16(unsigned short), u32(unsigned short), s8(signed char), s16(signed short), s32(signed long). The parameter setting depends on the type of data to be transmitted.
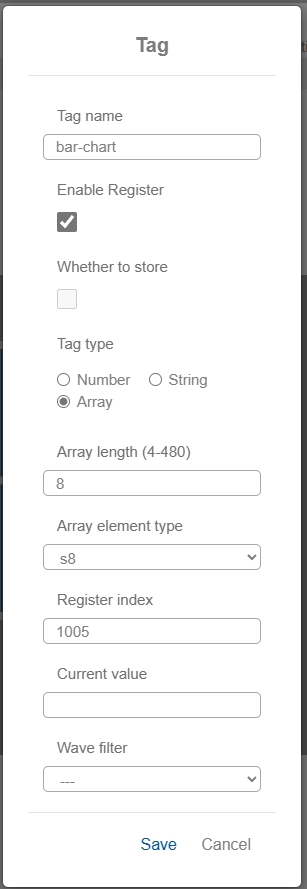
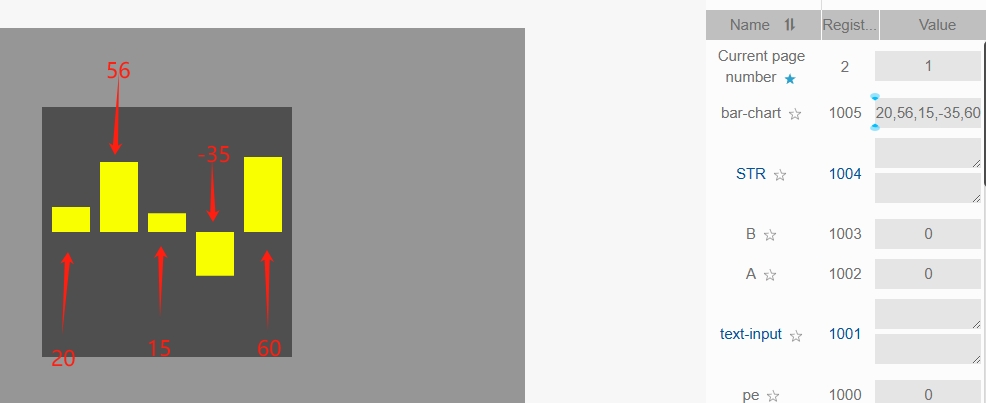
We will set the array type to s8 and the length of the array to 8. When we enter the array [20,56,15,-35,60] in the IDE simulation and press Enter, the bar graph control will display the image as follows: