Chart
The Chart control displays the input values as images and binds the variables to realize the function of an oscilloscope.

Click the "Add Control" button in the "Edit" menu and select "Chart" from the drop-down list of controls.
The message "Add Widget Successfully" will pop up in the upper right corner of the interface, and you can see the newly added control in the "Edit Area". Select the control, you can edit it in the "Properties" column.
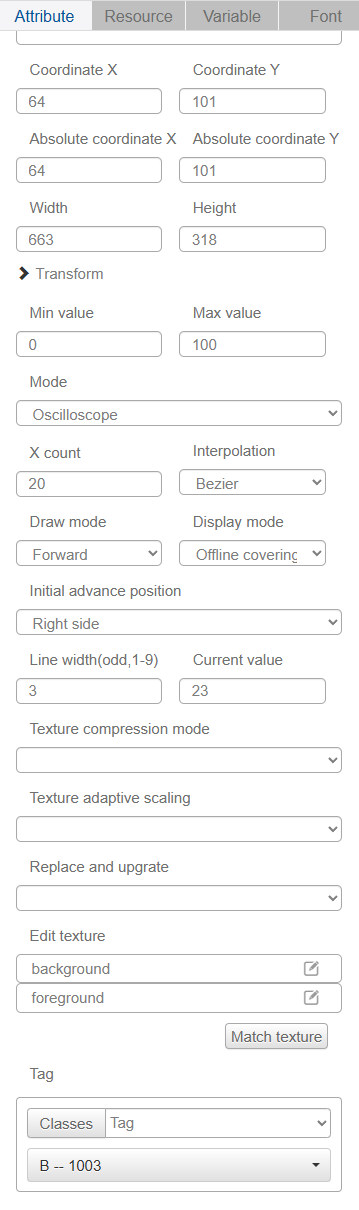
Name, ID, Coordinates, Width, Height, Block Touch, Transform, Texture Compression Mode, Replaceable Upgrade, and Texture are common attributes, which are introduced in the "Basic Design - Edit Attributes" section, so we won't repeat them here.
When "Draw" is selected as the mode, the ripples will be formed automatically by inputting the coordinate points several times:
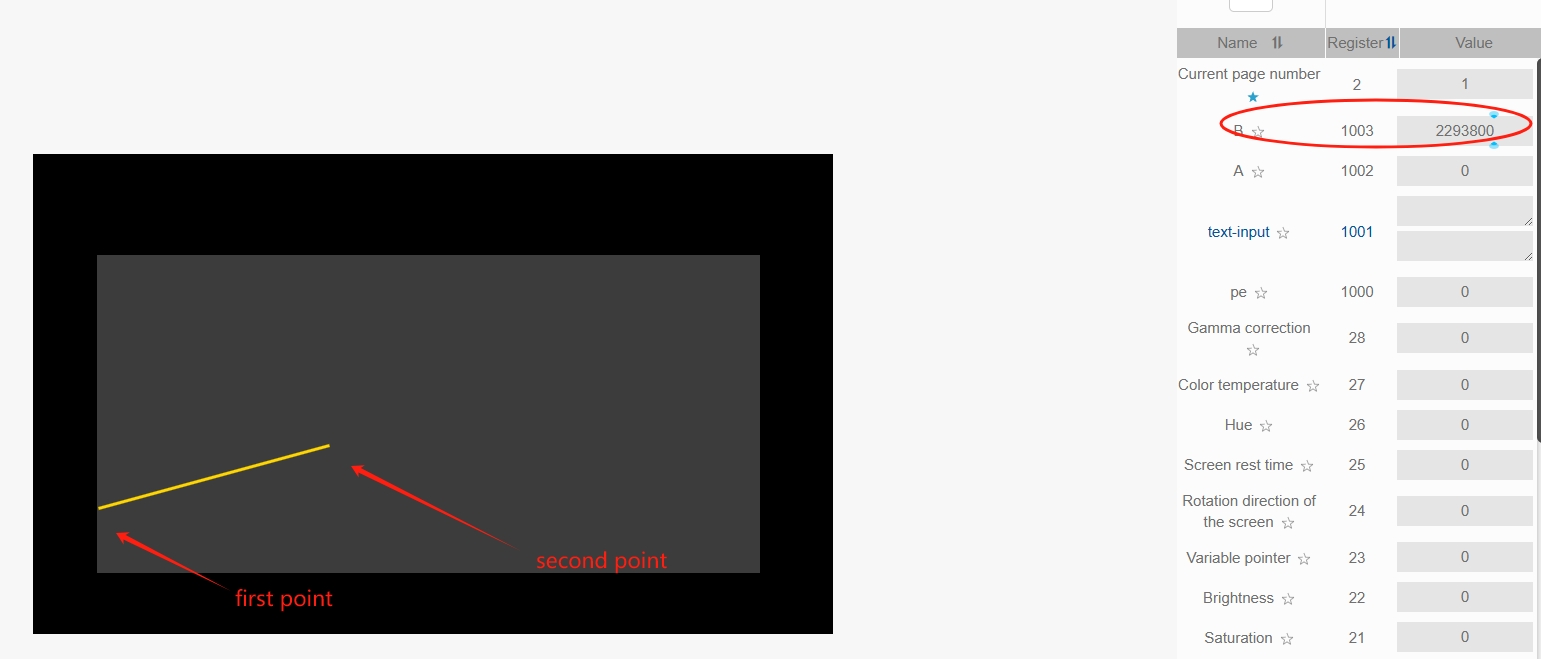
Minimum" and "Maximum" refer to the minimum and maximum values of the Y coordinate, and "X Minimum" and "X Maximum" refer to the minimum and maximum values of the Y coordinate. "X Min" and "X Max" refer to the minimum and maximum values of the X coordinate. The line width should be set to an odd number from 1 to 9. The coordinate (0, 0) is the position of the lower left corner of the control. The coordinate value is calculated as (x<<16)+y, e.g. coordinate (30,40) is (30<<16)+40, i.e. 1966120.
Example: The first point position (0,20), i.e. assignment 20. The second point position (35,40), i.e., assigned the value 2293800. The two dots will be automatically connected as shown below: Continuously assigning a value will form a ripple
When "Oscilloscope" is selected as the mode, it is only necessary to input the Y-coordinate value several times to form ripples:
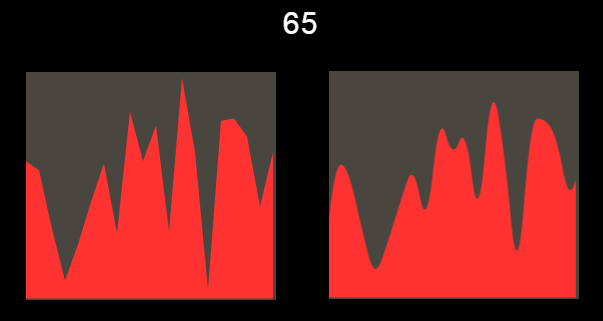
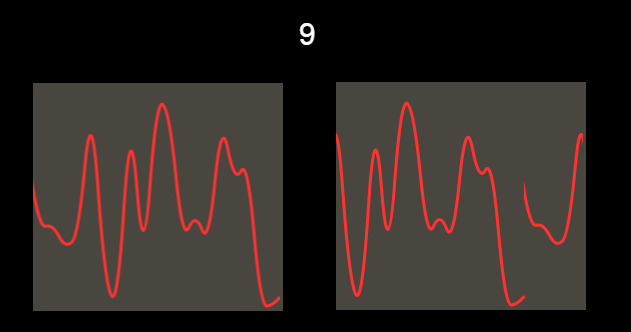
Minimum and maximum values are the range of values that can be displayed on the chart. X number is the number of points that can be displayed on the X coordinate. The system uses a proximity interpolation algorithm to display the input values, and the user can choose either linear interpolation or Bessel interpolation. The two interpolation displays are shown below, with linear on the left and Bessel on the right.
In the drawing mode, you can choose advance or loop. In advance mode, the newly input value is displayed on the rightmost side of the chart, and the waveform continues to move to the left; in cycle mode, the values are displayed sequentially from left to right, and after filling all the points in the horizontal coordinate, it will be refreshed from the leftmost side, and the difference is as follows, the left side is Advance, and the right side is Cycle.
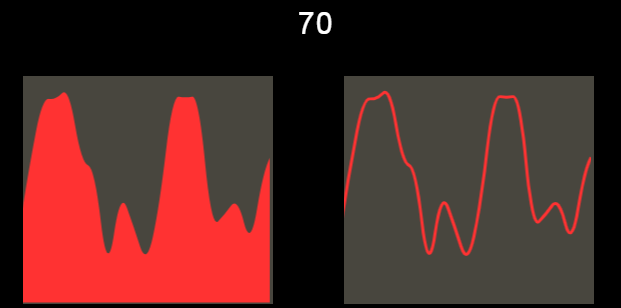
In display mode, you can choose underline mask or line, the difference is as below picture, the left side is underline mask, the right side is line.
Users can set the background color and foreground color of the chart. Depending on the display mode, the foreground color is the color of the line or masked area.
The line width needs to be set 1-9 odd.
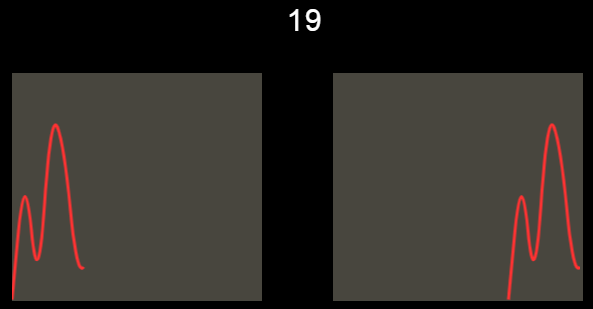
The initial advancement position can be selected as right or left, the difference is as follows, the left chart is left advancement, the right chart is right advancement.
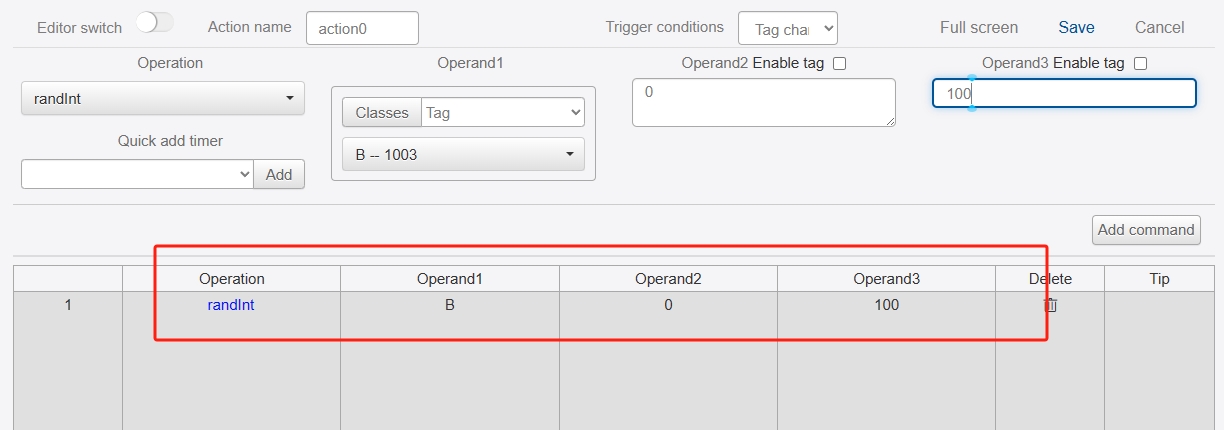
The chart needs to be bound to a variable of numeric type, and the randInt instruction can be used to generate a random number preview effect when making the chart.